Statistical Analysis
Mass spectrometry data is processed through a search engine (Mascot or XTandem!) to provide a list of identified proteins, and where required, relative or absolute quantification. The proteins are then subject to statistical analysis to identify significantly changed proteins:
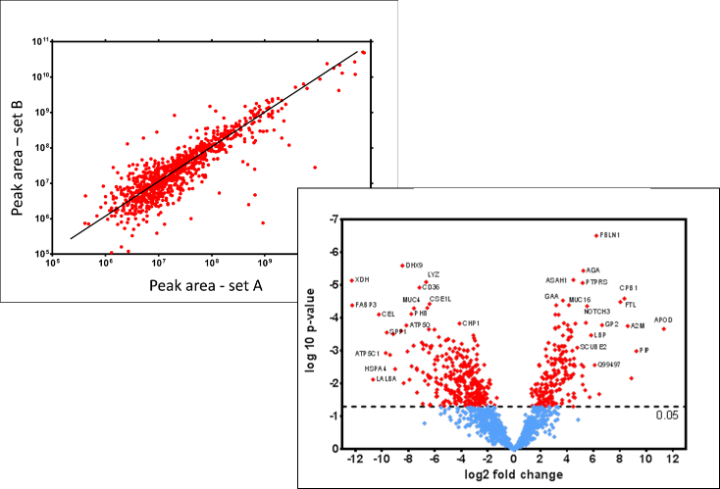
- Volcano plots for significant expression changes between multiple datasets (R Studio, Limma t-statistics)
- Correlation coefficients for comparison of paired datasets (PRISM, Student t-test)
- Hierarchical clustering for population studies (R Studio)
- Principal component analysis for cohort comparisons