

Getting started with Bibliometrics and Altmetrics
Table of contents
- Using metrics responsibly
- What are bibliometrics and altmetrics
- How to find and use bibliometrics and altmetrics
- Finding and using key author, article and journal bibliometrics and altmetrics
- Key author metrics – what, why, where?
- Key author metrics – how?
- Journal metrics – what, why, where?
- Journal metrics – how?
- Field Weighted Citation Impact (FWCI) What, why, where, how?
- Altmetrics – what, why, where, how?
- More support for bibliometrics and altmetrics
Using metrics responsibly
DORA
The University is a signatory to the Declaration on Research Assessment (DORA). DORA recognises the need to improve the ways in which the outputs of scholarly research are evaluated. Principles for the responsible use of research metrics at the University of Bradford have now been agreed. Limitations and best practice approaches to using metrics are discussed below.
What are bibliometrics and altmetrics and why should I be interested?
Bibliometrics, a definition:
"Bibliometrics is the quantitative analysis of written documents. It is frequently used to analyse scientific and scholarly publications." (CWTS 2018:3)
Bibliometrics is intended to help in evaluating research outputs and provide an indication of their impact. Traditionally, metrics are based on citation accounts - the number of times a research paper is cited by other papers since publication - but there are now other measures of impact available.
Altmetrics, a definition:
Altmetrics (alternative metrics) are data that can explain both the volume and nature of attention that research receives online. They are complementary to traditional citation-based metrics, e.g. citation counts and journal impact factors, and do not replace these. They measure overall reach and engagement of research outputs with social media, blogs and in the news.
Benefits of bibliometrics and altmetrics
- They provide evidence of the impact of your work, or that of your research group, or of a university. You could use this evidence when applying for a job, promotion or for research funding. It could be included in a CV.
- They help in identifying which journals to publish in, and finding new areas of research.
- They are used in some university rankings and the Research Excellence Framework.
- The Metrics Toolkit provides further use cases.
Try our Reading list of materials on bibliometrics and altmetrics to find out more. This includes books, articles and websites to introduce you to bibliometrics, and a section on responsible metrics.
A quick reference guide to bibliometrics, produced by Elsevier, is available to view online.
How to find and use bibliometrics and altmetrics
Elsevier produced a webinar video for the University of Bradford in August 2020 which gives an excellent overview of Bibliometrics and Altmetrics.
The Metrics Toolkit is a resource for researchers that provides guidance for demonstrating and evaluating claims of research impact. It is an excellent starting point to help in quickly understanding what a metric means; how it is calculated; and if it is a good match for an impact question. It covers both traditional metrics and altmetrics.
The toolkit is used to find evidence-based information about research metrics across disciplines, including an explanation of how each metric is calculated, where you can find it, and how each should - and should not - be applied.
Finding and using key author, article and journal bibliometrics and altmetrics
A good explanation of the full range of different metrics is provided in the Metrics Toolkit.
The metrics covered are (Aug 2022):
- Altmetric attention score
- Blog mentions
- Citation percentiles and 'Highly Cited' labels
- Citations - Articles
- Citations – Books and book chapters
- Citations – Data
- Citations – Software
- Downloads – Articles
- Downloads – Books and book chapters
- Downloads – Software
- Field Weighted Citation Impact
- Github – Forks, collaborators, watchers
- Goodreads – Ratings and reviews
- h-index
- Journal Acceptance Rate
- Journal Impact Factor
- Mendeley Readers
- Monograph [book] holdings
- Monograph [book] sales and ratings
- News mentions
- Policy mentions
- Publons score
- Pubpeer comments
- Relative Citation Ratio
- Twitter mentions
- Wikipedia citations
Never rely on only one single tool when gathering bibliometric data. Results will vary from different sources as they index a different range of publications. See section on how to use bibliometrics in a responsible way.
The main sources for bibliometrics are:
- Web of Science, including Journal Citation Reports
- Scopus
- Google Scholar
Key author metrics - what, why, where?
What?
Author metrics are used to track how often an author's work is cited; and to demonstrate the reach and impact of their work.
The author citation information in Scopus, Web of Science and Google Scholar also includes the h-index (Hirsch index) score. This is designed to measure an author's productivity and impact. It measures a researcher's impact, based on the number of citations to their work.
An author has index h, if h of their papers has been cited at least h times. For example, an author has published 20 papers which have been cited 20 times, giving them an h-index 20. "Hirsch reckons that after 20 years of research, an h index of 20 is good, 40 is outstanding, and 60 is truly exceptional." (Oswald N, 2009)
Authors who do not do well in the h-index:
- Those who write large numbers of low citation papers.
- Those who have only one highly cited paper.
- Younger authors.
The advantages and disadvantages of the h-index, and how to calculate it are covered in the Web of Science: h-index information guide.
Web of Science Author Impact Beamplots are a newer way of visualizing the citation performance of an author. A Beamplot shows the volume and citation impact of a researcher’s publication portfolio through time. Each paper’s citation count is normalized (i.e., benchmarked against other similar publications from the same discipline) and measured as a percentile.
Author Impact Beamplot or H Index?
An Author Impact Beamplot was developed as an alternative to the H Index and tries to combat criticisms of the H Index, notably that the H Index is biased in favour of senior researchers and against researchers who have taken a career break or published less at any given time.
Why?
Author metrics provide evidence of the impact of your work, or that of your research group, or of a university. This evidence can be used when applying for a job, promotion or research funding. It could also be included in a CV. They are also used to discover key researchers in a field, track the work of colleagues and identify potential collaborators.
Where?
Web of Science, Scopus and Google Scholar can be used to find citations for your own articles; an author you are interested in; or your h-index. NB! There is no single citation analysis tool that collects all publications and their cited references. The University of Michigan have explored the benefits and limitations of using Google Scholar for citations; and The Centre for Science and Technology Studies at Leiden University have flagged up some advantages and limitations of using Google Scholar. Google Scholar's own help pages on metrics are also available.
Author Impact Beamplots for an individual author are now shown on the Web of Science new interface.
Key author metrics - how?
NB! These step-by-step instructions are correct on 1 Aug 2020. Contact your subject librarian for further guidance.
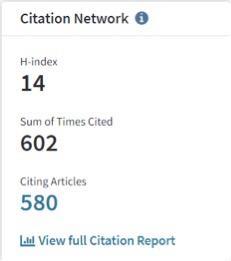
How to find citation counts for your articles and your h-index - Web of Science
- Go to Summon and search for "Web of Science", and follow the link to access it.
- Click on "Author search".
- Enter your name in the search boxes.
- Click on "Find".
- If given a list of authors to choose from, identify yourself by organisation or publications. Click on your name to find a list of your publications, overall citation and h-index. Click on the "View full Citation Report" for more detailed information.
You can click on individual articles to find citation details for the paper, and follow the "Times Cited" link of an article to see who has cited it.
How to find your Author Impact Beamplot
- Go to Summon and search for "Web of Science", and follow the link to access it.
- When you go to Web of Science, you will see the message “The new Web of Science is here” – click on the Check it Out button, and then search by author.
- The Beamplot summary for the author is shown. Click on View Full Beamplot for full details.
The Author Impact Beamplot Summary displays three points:
- Minimum publication percentile
- Overall median publication percentile (indicated by a green circle)
- Maximum publication percentile
Advice on interpreting a beamplot is available or watch this short beamplot overview video to find out more. A more detailed look at Beamplots is also available.
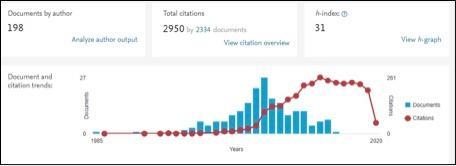
How to find citation counts for your articles and your h-index - Scopus
- Go to Summon and search for "Scopus". Follow the link to access the database.
- Choose the "Authors" search.
- Enter your name details and affiliation OR your ORCID number.
- Click on "Search".
- If more than one profile appears, choose your profile. You can identify this through the documents link.
- You will be given a list of your publications and citation information. There will be further links for you to follow to look at the different publications, see who has cited you, and view a citation overview and h-graph.
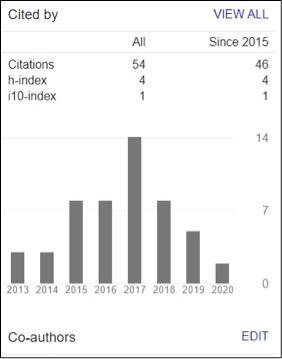
How to find citation counts for your articles and your h-index - Google Scholar
- Go to Google Scholar.
- Click on "My Profile" on the top left of the screen, and log in with your Google account. Create a Google account if you do not already have one.
- Complete your profile. Google Scholar will show you a list of articles you have written.
- Select the articles you have written, to see information on citations and h-index. The i10 index is also included. This refers to the number of papers with 10 or more citations.
Journal metrics - what, why, where?
What?
These metrics look at the impact of individual journal titles. They measure the frequency with which an average article in a journal has been cited in a particular year. Impact factors vary in different subject disciplines.
Why?
Journal metrics can help identify which journals to publish in, and find new areas of research.
Where?
To find journal metrics, such as journal impact factors, use Web of Science, Scopus and Google Scholar. NB! There is no single journal metrics analysis tool that covers all publications.
Journal metrics - how?
NB! These step-by-step instructions are correct on 1 Aug 2020. Contact your subject librarian for further guidance.
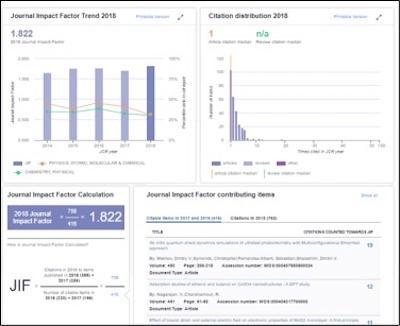
How to use Journal Citation Reports in Web of Science
Web of Science covers journal citation report metrics, including Cited and citing half-life, Journal Impact Factor, Immediacy Index, Quartiles and JIF Percentiles. You can search for a specific journal title or rank journals in a category.
Step-by-step instructions
- Go to Summon and search for Web of Science. Follow the link to the database.
- Click on "Journal Citation Reports" at the top of the screen.
- You have the option to search for a title in the search box, or click on one of the boxes to start searching. You can choose to browse by journal or category, or create custom reports.
- If you search for a title, you will be prompted for matches as you start typing. Select the journal you are interested in, and you will be given a detailed page of metrics. Some explanation of metrics used is provided on screen.
Journal Citation Reports: learn the basics contains a good introductory video and help guides, if you need more information about the different metrics in Web of Science.
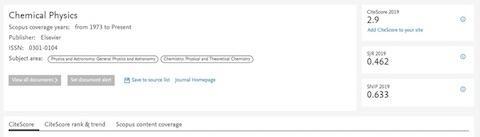
How to use CiteScore in Scopus
CiteScore is a way of measuring the citation impact of journals, and is based on the average citations received per document. NB! CiteScore updated its methodology in 2019.
Step-by-step instructions
- Go to Summon and search for Scopus. Follow the link to access the database.
- Click on "Sources" at the top of the screen.
- Use the drop-down box at the top of the screen to search by subject area or title of a journal. You can also search by publisher or ISSN.
- Type in the name of the journal, if searching for a title. You will be prompted for matches as you start typing. Select the journal you are interested in, and you will be given a detailed page of metrics. Clicking on the "i" symbols next to the metrics will provide more information about the particular metric.
- If you decide to search by subject area, you wil be prompted with a drop-down box to select the subject area, e.g. Cancer research.
Find out more about the different metrics available:
- CiteScore Metrics: the basics PDF provides a good introduction to CiteScore.
- Elsevier have produced a CiteScore help guide and Citescore introductory video.
- Step-by-step Citescore online tutorial.
How to use journal metrics in Google Scholar
Google Scholar lets you browse the top 100 publications in several languages, ordered by their five-year h-index and h-median metrics. To see which articles in a publication were cited the most and who cited them, Click on its h-index number to view the article as well as the citations underlying the metrics. You can also explore publications in research areas of your interest.
To find out more, Google Scholar offer an overview on journal metrics.
Field Weighted Citation Impact (FWCI) What, why, where, how?
What?
FWCI shows how an article's citation count compares to similar articles in the same field and timeframe. It measures the number. of citations received by an article divided by the expected no. of citations for similar articles. A FWCI of 1 means that the output performs as expected for the global average; an FWCI of 1.44 means 44% more citated than expected.
Why?
FWCI measures the citation impact of the output itself, not the journal in which it is published. Because the FWCI includes field normalization, theoretically, the score should be a better indicator of performance than a raw citation count. Find out more about Field Weighted Citation Impact.
Where?
You will find FWCI in Scopus.
How?
Try this short online article metrics tutorial by Scopus which includes a section on FWCI.
Altmetrics - what, why, where, how?
What?
Altmetrics are used to track social media interest in your research. These complement but do not replace traditional bibliometrics.
Why?
Altmetrics could be used alongside more traditional metrics on a CV, or iin making a funding application, or to help you find new research collaborators.
Altmetric have produced a short video as an introduction to altmetrics and why you might want to use them.
Where?
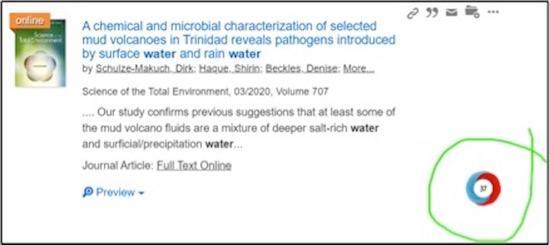
One of the main sources of altmetrics is a company called Altmetric who provide and collect altmetrics for journals and articles. Many large publishers use the company's trademark Altmetric donut in search results. For instance, Summon search results include the donut. Individual researchers can install a free Altmetric bookmarklet tool. This will allow you to view the online shares and mentions of an article with a single click.
There are also PlumX Metrics in Scopus which categorize metrics into five categories. Find out more about PlumX Metrics.
How?
Altmetric donut: You can see this shown in Summon search results and results in some journal packages. You can also install your own Altmetric bookmarklet tool as described above. The colours and numbers used in the donut are used to illustrate the volume and type of attention a research output has received. The Altmetric Attention Score in the middle of the donut is the count of all the attention a research output has received from blogs, social media and newspapers. Different sources are given different weightings. Altmetric have produced a guide for interpreting the colours and score.
PlumX Metrics: You can use this through Scopus. Similar to the Altmetric donut, PlumX present metrics data in a visual way, a Plum Print, which dynamically changes to indicate the relative number of metrics in each category.
When viewing full details of a journal article in Scopus, click on the Plum Print image in the Metrics box on the right hand side of the screen to view the usage, captures, mentions, social media and citations.
The 5 categories used are defined as:
- Usage (Green): indicates whether anyone is reading the articles or otherwise using the research. Includes Clicks, Downloads, Views, Plays.
- Captures (Purple): indicates that someone wants to come back to the work. Captures can be an early indicator of citations. Includes Bookmarks, Code Forks, Favorites, Readers, Watchers.
- Mentions (Yellow): measurement of activities such as news articles or blog posts about research. They indicate that people are actively engaging with the research. Includes Blog posts, News mentions, Comments, Reviews, Wikipedia links.
- Social media (Blue): help measure "buzz" and attention. This category includes Facebook likes, Shares, Tweets.
- Citations (Red): category for both traditional citation indexes such as Scopus, and a place to capture new citations that help indicate social impact such as Clinical or Policy Citations. Includes Citation Indexes, Patent Citations, Clinical Citations, Policy Citations.
Researchers can use altmetrics in varying ways. An Altmetrics helpsheet has been provided on how to:
- use altmetrics on a CV;
- help in making a funding application; and to
- help in finding new research collaborators.
Limitations of metrics
To ensure fair assessment of research, metrics should not be used on their own. In particular, use journal and author metrics with caution and understand the key limitations outlined below.
High citation counts
High citation counts can be used to show the influence of an article, but you should not assume they are an indicator of quality and validity. A controversial article may be cited frequently, because others are arguing against its findings. A fraudulent paper may get a high number of negative citations. Older material will tend to be more highly cited as it has had more time to be cited. Citation-based metrics should not be interpreted as a direct measure of research quality.
Example
The 1998 article by Wakefield et al, which fraudulently reported an association between vaccination and autism, has a very high citation countand continues to accumulate citations even after it was retracted.
Wakefield AJ, Murch SH, Anthony A et al. Ileal-lymphoid-nodular hypeplasia, non-specific colitis, and pervasive developmental disorder in children [retracted in: Lancet. 2010; 375(9713): 445]. Lancet. 1998; 351(637-641. doi:10.1016/S0140-6736(97)11096-0.
Comparing different researchers
Do not use the author metric h-index to compare the output of different researchers. Raw citation numbers are not comparable from person to person, as metrics increase over time and are more likely to be higher for an experiences researcher who has published more papers over a long period of time than an early career researcher, so will discriminate against early career researchers on the basis of the length of their career and nothing else.
Comparing different disciplines
Do take care when using journal metrics to compare different disciplines which have different citation behaviour and where that behaviour may vary over different periods of time. Some research areas, such as medicine, cite papers more than others and different fields of research publish at different rates. Publications in different disciplines will also be cited at a varying pace. There are metrics available which will try to take citation behaviour within a field into account, to provide a reasonable comparison. The table below, provided by Scopus (2020), shows which key metrics are field weighted.
| Indicator | Database | Field weighted | Document types | Year range |
|---|---|---|---|---|
| CiteScore | Scopus | No | Articles, reviews, book chapters, conference papers and data papers | 4 |
| SJR | Scopus | Yes | Articles, reviews, conference papers and short surveys | 3 |
| SNIP | Scopus | Yes | Articles and reviews | 3 |
| Impact Factor | Web of Science | No | Articles, reviews and conference papers | 2 and 5 |
Using different sources and more than one source
It is important to look at more than one source of metrics analysis, as different sources of metrics will yield different results. Resources such as Scopus and Web of Science cover different journals, so will give you distinct results for metric analysis. Using Altmetrics will give you a broader picture. Be careful of sources like Google Scholar where it is less clear what is covered.
Using journal impact factors
A high impact factor does not tell you anything about the quality of the individual articles within the journal. The content of a paper is more important than where it has been published. DORA's first recommendation is not to use journal based metrics such as Journal Impact Factors as a surrogate measure of the quality of individual research articles.
Best practice - 3 dos and don'ts
Now that you have read some of the limitations of bibliometrics, watch this short video on How to use bibliometrics effectively, and follow these three best practice principles:
- Do ensure you are clear and transparent in the metric methodology you are using, and consider whether the metric you chose is appropriate for the aspect of research performance you are looking at.
This generally means using relative measures that give context and more accurate means of comparison. These include metrics related to publications such as article-based metrics, e.g. field weighted citation ration, rather than absolute measures or concrete totals, such as journal-based metrics, e.g. Journal Impact Factor, SJR, SNIP or author metrics, e.g. h-index.
Below we have made available a document for more information on the pros and cons of different metrics.
- Do use quantitative alongside qualitative input such as peer-review and expert opinion.
- Do not use one quantitative metric in isolation - research performance should not be evaluated against a number of metrics used together. For quantitative metrics use at least two distinct metrics sources to reduce bias.
The pros and cons of key metrics
If you require this information in an alternative format, please contact our team. You can also read our Website Accessibility Statement.
More support for bibliometrics and altmetrics
- The library offers an Introduction to Bibliometrics workshop.
- Talk to your Faculty Librarian.
- Learn more about bibliometrics and how to use them responsibly through our recommended books, reports and articles.